Most SEO benchmarks come from surveys, or from tools that estimate a site’s traffic from the outside. This one comes from the inside: the analytics of 1,160 websites we manage.
Every website we manage reports into one warehouse that pulls Google Analytics 4, Google Search Console, Google Business Profile and call-tracking data together. For this post we used GA4 for 1,160 websites, Search Console for 910 sites, Business Profile data for 1,882 locations and call tracking for 431 businesses. Unless a figure says otherwise, the period is October 2025 to September 2026 (Oct 1, 2025 to Sep 25, 2026 for GA4), and the data is as of September 27, 2026.
Two rules apply throughout. We show medians across sites, not totals or averages, so a handful of very large sites can’t pull the numbers up: the median is the site in the middle, with half the sites above it and half below. And no business is identified. Our own website is left out.
For scale: we’ve run SEO for 2,198 businesses across 128 sub-industries. In the last 12 months, those websites received 64.1 million visits from Google organic search, and our SEO tracking numbers took 58,734 calls of a minute or longer. Here is what “good” looks like in that data.
Organic search brings 21.5% of visits to the median site, and it depends a lot on your industry
Across all 1,160 sites, the median site gets 21.5% of its visits from organic search, roughly 1 in 5. That single number hides a wide range. Grouped by industry, the median runs from 44.2% for medical practices down to 4.2% for jewelry brands.
The pattern is fairly intuitive. Businesses people look up when they have a need, such as a doctor, an HVAC company or a law firm, tend to get more of their visits from search. Product brands that sell online tend to get more of theirs from paid ads, social media and email, so organic is a smaller slice even when it performs well. If your site sits well below your industry’s median, there is probably room to grow. If it sits well above, organic search is carrying a lot of your business, and it’s worth protecting.
| Industry | Median share of visits from organic search | Sites |
|---|---|---|
| Medical practices | 44.2% | 16 |
| HVAC | 35.4% | 16 |
| Manufacturers | 27.6% | 19 |
| Law firms | 27.3% | 16 |
| Real estate | 25.2% | 19 |
| Dentists | 24.6% | 18 |
| Contractors | 23.5% | 28 |
| Car dealerships | 21.7% | 61 |
| Roofers | 18.5% | 19 |
| SaaS | 17.8% | 17 |
| Consultants | 17.8% | 33 |
| Food & beverage brands | 10.9% | 26 |
| Fashion brands | 9.5% | 29 |
| Jewelry brands | 4.2% | 18 |
6 in 10 websites get more visitors from Google organic search than from any other source except direct
Set direct visits aside, and Google organic search is the biggest source of visitors for 60% of the websites (691 of 1,160). Paid search is the next most common leader, on 16% of sites.
Why set direct aside? In GA4, “direct” collects every visit it can’t attribute to a source, from typed-in addresses and bookmarks to links in apps and untagged emails, so it is a mixed bag rather than a marketing channel. If you count it anyway, organic search is still the single largest source on 22% of sites.
 79% Increase in site trafficIndustrial Cleaning Company Drives Conversions by 8xSee the case study →
 43% Increase in revenueHVAC Service Company Increases Lead Volume by 14xSee the case study →
29% of a typical site’s leads and sales start with an organic search
Traffic is only useful if it turns into business. For the median site, 29% of its conversions come from visitors who arrived from organic search. A conversion here is whatever the site owner counts as one in GA4 (its “key events”): a form submitted, a call button tapped, a purchase. We only included sites with at least 50 conversions in the period, 956 in all.
That is a larger share than organic’s median share of visits (21.5%), although the two medians cover slightly different sets of sites. Either way, organic visitors are not just browsing.
Position 1 gets 2.5x the clicks of position 2
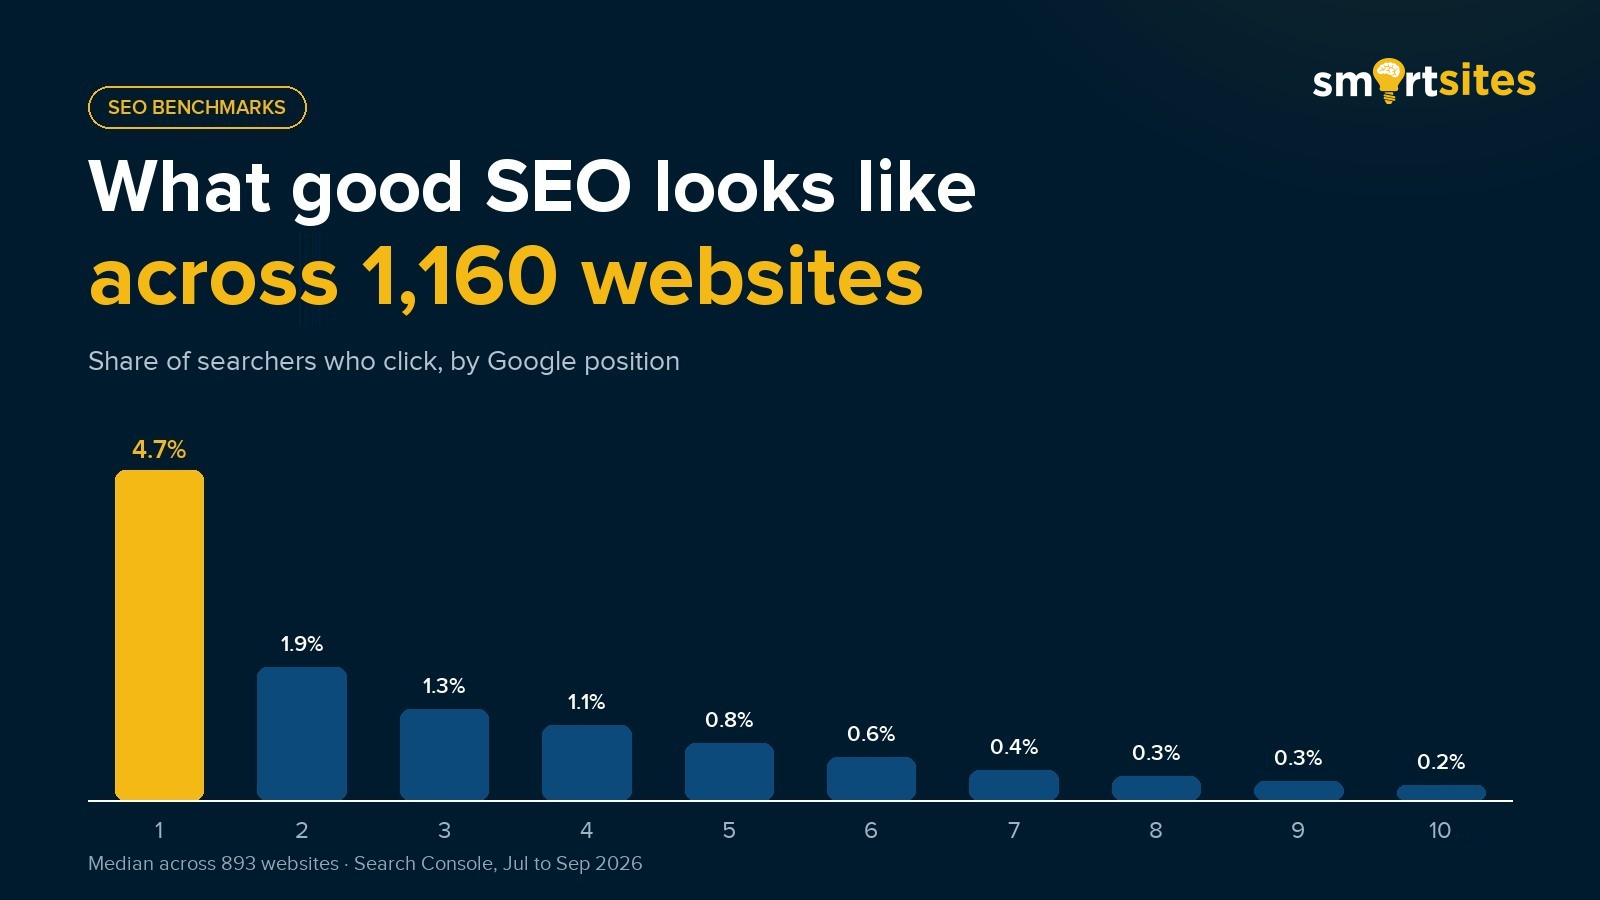
Search Console tells us, for every search a site shows up for, where it ranked and how often people clicked. From that we built our own click-through curve: for each Google position, the share of searchers who clicked, as a median across 893 websites. Each position includes at least 638 sites with 500 or more impressions at that position, 359.1 million impressions in all, from Jul 1 to Sep 24, 2026.
| Google position | Median click-through rate | Sites |
|---|---|---|
| 1 | 4.72% | 734 |
| 2 | 1.90% | 666 |
| 3 | 1.30% | 640 |
| 4 | 1.08% | 638 |
| 5 | 0.81% | 649 |
| 6 | 0.62% | 654 |
| 7 | 0.43% | 658 |
| 8 | 0.35% | 660 |
| 9 | 0.27% | 662 |
| 10 | 0.22% | 658 |
The drop is steep. The top spot gets 2.5 times the click rate of the second, and position 1 gets 22 times the click rate of position 10. Page two barely registers: 0.16% for positions 11 to 20 and 0.05% beyond that. A few spots make a big difference.
These rates are lower than many published click-through studies. Ours counts every search a site appeared for, including long, rare searches and searches where ads, maps or AI answers sit above the organic results, and it uses the median site rather than a pooled total. The shape of the curve matters more than the exact percentages.
71% of clicks come from top-3 rankings
The same data shows where a site’s clicks actually come from. For the median site, 71% of its Google clicks come from searches where it ranks in the top 3. Positions 4 to 10 bring 21%. This is the median of 686 sites with at least 100 clicks in the period; pooled across all of those sites, the top 3 bring 69%.
In practice this is why we treat moving a page from position 5 to position 2 as a bigger win than adding another page-one ranking at position 8.
916K search terms on page one of Google
Between Jul 1 and Sep 24, 2026, the websites ranked on page one of Google for 916,270 search terms, 170,678 of them in the top 3 (893 sites; a term counts when its average position was 10 or better and it had at least 10 impressions). The typical site ranks on page one for 260 terms, 47 of them in the top 3.
Most of those terms are not the one or two head keywords a business thinks of first. They are the long list of specific searches real customers type. Over the last 12 months (Oct 1, 2025 to Sep 24, 2026) Google sent these sites 39.2 million clicks from 3.3 billion impressions, across 910 sites.
A Google Business Profile, per location per month: 637 views, 51 direction requests, 35 website clicks, 11 calls
For local businesses, the Business Profile is often the first thing a customer sees. We looked at the monthly performance data of every profile we manage and worked out, per business, the average month for one location. The median business (956 businesses with at least six location-months, 1,834 locations) gets the figures below.
| Business Profile action | Median per location per month | Total, all 1,882 locations, 12 months |
|---|---|---|
| Profile views | 637 | 62.0 million |
| Direction requests | 51 | 2.9 million |
| Website clicks | 35 | 4.1 million |
| Phone calls | 11 | 1.6 million |
Added up across all 1,882 locations, that is 62.0 million profile views and 2.9 million direction requests in 12 months. A profile that sits far below these medians for its industry is usually missing photos, categories, reviews or up-to-date hours.
Organic vs paid: 3.3% vs 3.4% conversion rate
A common assumption is that paid search visitors are more ready to buy than organic ones. In our data the gap is small. The median site converts 3.3% of its organic search visits and 3.4% of its paid search visits (1,159 sites with organic traffic, 953 with paid search, GA4, Oct 1, 2025 to Sep 25, 2026).
Organic visitors convert about as well as paid visitors, and you don’t pay for the organic click. That doesn’t make paid search a waste: it is faster, and it reaches searches you don’t rank for yet. But it is a good reason not to treat SEO as the soft channel.
How we count each figure
Based on the websites we manage: GA4 for 1,160 sites, Search Console for 910 sites, Google Business Profiles for 1,882 locations and call tracking for 431 businesses, Oct 2025 to Sep 2026 unless a figure says otherwise. Medians across sites. No business is identified, and our own website is excluded. Data as of September 27, 2026.
- 2,000+ businesses. Distinct businesses in our records with SEO as an active or past service. Roster as of 2026-09-26.
- Organic visits, organic share, top source, conversions, organic vs paid. GA4 default channel groups for every connected GA4 property with 1,000+ sessions in the window. Properties with a sitewide conversion rate above 50% (broken tracking) are left out. Shares and rates are worked out per site first; we show the median site. Conversions are each site’s own GA4 key events. Oct 1, 2025 – Sep 25, 2026.
- Click-through curve, top-3 share, page-one terms, Google clicks. Search Console query data for the same websites (one property per domain, our own site excluded). The position is Google’s average position for that search on that day. Full query detail starts July 2026, so these use Jul 1 to Sep 24, 2026; the 12-month click total uses Search Console’s daily site totals, de-duplicated. Jul 1 – Sep 24, 2026.
- Industry table. Same sites, grouped by the business’s industry in our records. Only industries with 15 or more sites are shown. Oct 1, 2025 – Sep 25, 2026.
- Business Profile. Business Profile Performance API. Per business: totals divided by location-months, then the median business (6+ location-months). Oct 2025 – Sep 2026.
- Calls to SEO numbers. Calls of 60 seconds or more to tracking numbers labelled SEO, organic or Business Profile (numbers labelled PPC excluded). Oct 1, 2025 – Sep 25, 2026.
See where your site stands
Every SEO engagement includes the same live dashboard these numbers come from: organic visits, conversions, calls and rankings from your own analytics, updated nightly, next to the benchmarks for your industry. If you want to know how your site compares, see how our SEO services work or ask for a free SEO proposal.
“We are ranking for thousands of new keywords every month and our organic traffic and clicks have grown by thousands as well.”
 Abigail HardinUp-To-Date Theatricals LLC