Digital Marketing Report Dashboard: 5 Best Practices

Clement Foo
Senior Digital Content Manager
Digital marketing reports are essential for well-informed decision making and successful strategizing in the digital age. A dashboard is an essential tool for bringing all your key metrics into one easy-to-read and easy-to-navigate view, allowing you to easily glean valuable insights from the numbers. Here are five best practices for creating effective digital marketing report dashboards:
Focus on Your Most Important Metrics
When creating a dashboard, your focus should be on including only the metrics that are most important to your business. Adding extraneous metrics complicated matters and obscures the main points of analysis. Pick five or six key performance indicators that align with your business objectives and create graphs and charts that clearly illustrate these metrics over time.
Choose Easy to Read Visualizations
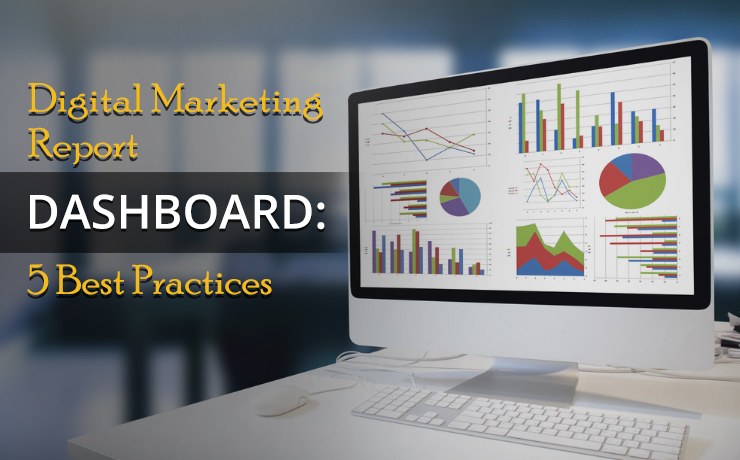
Visuals should be simple, intuitive, and easy to understand at a glance. When selecting visualizations for your dashboard, we suggest using graphs rather than tables; it’s easier on the eyes and conveys information faster than lists of numbers. Bar charts are great for showing direct comparisons between data sets over time; pie charts show how different sections make up a whole; line charts demonstrate trends; heatmaps help visualize relationships quickly etc.
Break Down the Data by Time Periods
Breaking data down is crucial when monitoring changes in performance over time – it allows you to identify seasonality, pinpoint areas of growth or decline, determine causes of anomalies etc. Filtering data by weekly, monthly or yearly periods will enable you to compare successive time periods effectively.
Develop Custom Widgets & Reports
As businesses evolve so do their requirements for understanding their customers’ behavior and analyzing performance across various online channels comes with its own complexities. Create custom widgets or reports tailored specifically towards drilling down into detailed segments within slightly varying conditions – all within one dashboard view – so you can find answers quickly and build actionable solutions as required.
Test & Adjust Dashboard Settings Regularly
Dashboard settings change constantly as campaigns progress or equipment advance changes. Test out different settings regularly when checking the analytics of campaigns, tools for optimization and address any discrepancies between expected results versus actual results swiftly. This will ensure better control over future campaign outcomes as well as minimize any problems that might arise during advertising execution in future months. A digital marketing report dashboard is a one-stop-shop for all your digital marketing data. It’s a place where you can view and analyze everything from website traffic to social media engagement to email marketing performance, all in one central location. And the best part? A good digital marketing report dashboard makes it super easy to understand all that data. It’s like having a personal data translator. But, not all dashboards are created equal. Choose a digital marketing report dashboard that’s right for your business.
 Free
Consultation
Free
Consultation Free
Google Ads Audit
Free
Google Ads Audit